Archiv der Kategorie: Communication

Communication consists of perception, thought models and communication behavior.

Showing figures smartly

More and more figures are nowadays created and used as the basis for decisions. This leads to the fact that one does not see the forest for the trees. Charts provide a way out. Unfortunately the users do not always consider the influence of the style of the presentation. This is amazing, since the acceptance of a message is reinforced by showing figures smartly.

Visualisierungen EXCEL scribble

Pure numbers do not always clearly convey the desired impression. Luckily most computers have nowadays MS-EXCEL with various business diagrams, like column, line, circle and bar charts etc. Graphical presentations are beneficial. Those charts add to the actual numerical value a graphical aspect: larger or smaller, rising or falling, more or less similar etc. This strengthens the desired statement. The following aspects should be considered.
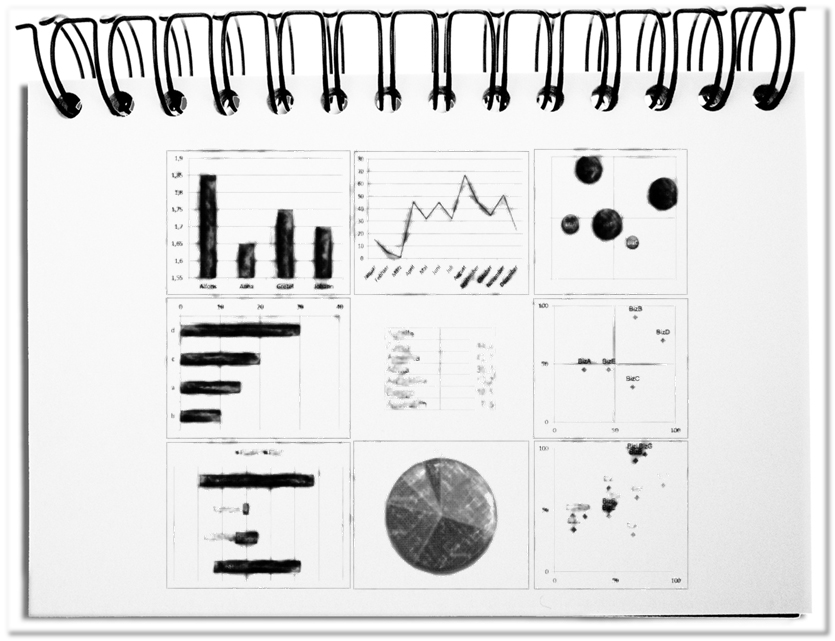
  • Size
    If orders of magnitude, like quantity, length, performance etc. are presented and compared, the bar charts or bar graphs are recommended. Thus, the different values can be prepared with horizontal bars or vertical columns side by side. The choice of the range strengthens thereby the message. Ranking becomes visible through additional sorting. The number of values that might be presented should be adapted to the presentation: for projections 7plusminus2, for A4 formats not more than 40 per page.
  • Progressions
    Values that change over time are represented with the line diagram. Rising costs, employee fluctuation or changes of temperature can also be represented over very long periods. The line conveys intuitively the course of time from left to right. The number of visualized values is defined by the question, whether single values or general progressions are important.
  • Portions of a whole
    If you want to show the portions of a whole, the circle or pie chart is perfect. The total circle represents thereby the 100%. If you want to compare the portions of different wholeness’s, you can use stacked bar charts. Usually the described elements should not exceed
  • Correlations
    Scatter diagrams help showing patterns, in order to be able to recognize dependencies of values. Thus, the BCG matrix shows, based on a joint look at market growth versus market share, in which products you should invest or not. Additionally, scatter diagrams can be used, in order to identify unusual pairs of value that arise outside of the value cloud.

Bottom line: For various purposes specific representation types are best. Size comparisons are represented by column and bar charts. Courses of time are shown with line diagrams. Parts of a whole are prepared with circle or pie charts. Correlations become visible with scatter diagrams.

What disturbs the brain storm?

Joint thinking is determined by the effort of at least two people to create ideas. An efficacious approach is the brainstorming. To make it work certain influences have to be avoided, which obstruct the production of ideas. But what disturbs the brain storm?

Brainstorm

The following aspects hinder the barrier-free gushing of ideas in groups.

  • Suppress criticism
    As long as a thought so long is not thought through, it behaves like a seedling. A certain size must be reached, in order to be viable. That is also true for ideas. For this reason each form of criticism or valuation should be suppressed, so that the idea can reach a certain maturity level.
  • Natural thinking
    The difficulty is the letting out of an idea. For this reason ALL thoughts should be able to reach the surface barrier-free. Co-thinkers can limit each other quickly, if they keep their contribution due to fear of criticism. On the other side something similar can happen, if too much consideration is shown to others, in order not to injure them by, for example, too many own contributions. It is suggested to make the goal of the brainstorming to your own and to produce courageously and respectful your own contributions.
  • No Comments
    The clear cut between the production of ideas and the later selection and evaluation is essential, in order to come to as many as possible free thoughts. Especially killer phrases, like “Nobody understands”, “This is senseless”, “This is politically not correct”, “This never went well”, “This is not allowed”, “Typical!”, pollutes the process. It is better to make it clear to the involved people that the proposals will be discussed in the next step and that meanwhile any comments are forbidden.
  • Be aware of Groupthink
    In groups again and again patterns evolve that drive the cooperation in unwanted directions. This includes the tendency of trying to finish as fast as possible, dominant participants, who take over the control of the group or the attitude that the majority will fix the problem. To reduce these group effects, the meetings should be short.

Such trends can be avoided by assigning the facilitation of the brainstorming to a neutral person. The task consists of recognizing the previous aspects and to eliminate barriers.

Bottom line: In brainstorming, the participants stand in one another’s way. Anticipatory restraint leads to worse results, than could be actually possible. For this reason the disturbances in the brainstorm should be designated and explicitly forbidden in the beginning of the session. The best remedies are neutral third parties, who lead the brainstorming, in order to come in a group to the best possible results.